Scalping Tool with Dynamic Take Profit & Stop Loss### **Scalping Indicator: Summary and User Guide**
The **Scalping Indicator** is a powerful tool designed for traders who focus on short-term price movements. It combines **Exponential Moving Averages (EMA)** for trend identification and **Average True Range (ATR)** for dynamic stop loss and take profit levels. The indicator is highly customizable, allowing traders to adapt it to their specific trading style and risk tolerance.
---
### **Key Features**
1. **Trend Identification**:
- Uses two EMAs (Fast and Slow) to identify trend direction.
- Generates **Buy Signals** when the Fast EMA crosses above the Slow EMA.
- Generates **Sell Signals** when the Fast EMA crosses below the Slow EMA.
2. **Dynamic Take Profit (TP) and Stop Loss (SL)**:
- **Take Profit (TP)**:
- TP levels are calculated as a percentage above (for long trades) or below (for short trades) the entry price.
- TP levels are **dynamically recalculated** when the price reaches the initial target, allowing for multiple TP levels during a single trade.
- **Stop Loss (SL)**:
- SL levels are calculated using the ATR multiplier, providing a volatility-based buffer to protect against adverse price movements.
3. **Separate Settings for Long and Short Trades**:
- Users can independently enable/disable and configure TP and SL for **Buy** and **Sell** orders.
- This flexibility ensures that the indicator can be tailored to different market conditions and trading strategies.
4. **Visual Signals and Levels**:
- **Buy/Sell Signals**: Clearly marked on the chart with labels ("BUY" or "SELL").
- **TP and SL Levels**: Plotted on the chart for both long and short trades, making it easy to visualize risk and reward.
---
### **How to Use the Scalping Indicator**
#### **1. Setting Up the Indicator**
- Apply the indicator to your chart in TradingView.
- Configure the input parameters based on your trading preferences:
- **Fast Length**: The period for the Fast EMA (default: 5).
- **Slow Length**: The period for the Slow EMA (default: 13).
- **ATR Length**: The period for the ATR calculation (default: 14).
- **Buy/Sell TP and SL**: Enable/disable and set the percentage or ATR multiplier for TP and SL levels.
#### **2. Interpreting the Signals**
- **Buy Signal**:
- When the Fast EMA crosses above the Slow EMA, a "BUY" label appears below the price bar.
- The TP and SL levels for the long trade are plotted on the chart.
- **Sell Signal**:
- When the Fast EMA crosses below the Slow EMA, a "SELL" label appears above the price bar.
- The TP and SL levels for the short trade are plotted on the chart.
#### **3. Managing Trades**
- **Take Profit (TP)**:
- When the price reaches the initial TP level, the indicator automatically recalculates the next TP level based on the new close price.
- This allows traders to capture additional profits as the trend continues.
- **Stop Loss (SL)**:
- The SL level is based on the ATR multiplier, providing a dynamic buffer against market volatility.
- If the price hits the SL level, the trade is considered closed, and the indicator resets.
#### **4. Customization**
- Adjust the **Fast Length** and **Slow Length** to suit your trading timeframe (e.g., shorter lengths for scalping, longer lengths for swing trading).
- Modify the **ATR Multiplier** and **TP Percentage** to align with your risk-reward ratio.
- Enable/disable TP and SL for long and short trades based on your trading strategy.
---
### **Tips for Getting the Best Results**
1. **Combine with Price Action**:
- Use the Scalping Indicator in conjunction with support/resistance levels, candlestick patterns, or other technical analysis tools to confirm signals.
2. **Optimize for Your Timeframe**:
- For **scalping**, use shorter EMA lengths (e.g., Fast: 5, Slow: 13).
- For **swing trading**, use longer EMA lengths (e.g., Fast: 10, Slow: 20).
3. **Adjust Risk Management**:
- Use a smaller **ATR Multiplier** for tighter stop losses in low-volatility markets.
- Increase the **TP Percentage** to allow for larger price movements in high-volatility markets.
4. **Backtest and Practice**:
- Test the indicator on historical data to understand its performance in different market conditions.
- Use a demo account to practice trading with the indicator before applying it to live trading.
---
### **Conclusion**
The **Scalping Indicator** is a versatile and user-friendly tool for traders who want to capitalize on short-term price movements. By combining trend-following EMAs with dynamic TP and SL levels, it provides a clear and systematic approach to trading. Whether you're a scalper or a swing trader, this indicator can help you identify high-probability setups and manage risk effectively. Customize it to fit your strategy, and always remember to combine it with sound risk management principles for the best results.
Cerca negli script per "stop loss"

ATR Stop Loss v4This indicator plots the current ATR value, and the Long and Short stop losses. Watch the indicator and move your stop loss to the Long or Short as necessary.
Unlike other ATR indicators this one allows the user to customize the table placement of the ATR calculations, and the colors of each row on the table, and the text. The ATR factors can also be edited.

Liquidity VisualizerThe "Liquidity Visualizer" indicator is designed to help traders visualize potential areas of liquidity on a price chart. In trading, liquidity often accumulates around key levels where market participants have placed their stop orders or pending orders. These levels are commonly found at significant highs and lows, where traders tend to set their stop-losses or take-profit orders. The indicator aims to highlight these areas by drawing unbroken lines that extend indefinitely until breached by the price action.
Specifically, this indicator identifies and marks pivot highs and pivot lows, which are price levels where a trend changes direction. When a pivot high or pivot low is formed, it is represented on the chart with a horizontal line that continues to extend until the price touches or surpasses that level. The line remains in place as long as the level remains unbroken, which means there is potential liquidity still resting at that level.
The concept behind this indicator is that liquidity is likely to be resting at unbroken pivot points. These levels are areas where stop-loss orders or pending buy/sell orders may have accumulated, making them attractive zones for large market participants, such as institutions, to target. By visualizing these unbroken levels, traders can gain insight into where liquidity might be concentrated and where potential price reversals or significant movements could occur as liquidity is taken out.
The indicator helps traders make more informed decisions by showing them key price levels that may attract significant market activity. For instance, if a trader sees multiple unbroken pivot high lines above the current price, they might infer that there is a cluster of liquidity in that area, which could lead to a price spike as those levels are breached. Similarly, unbroken pivot lows may indicate areas where downside liquidity is concentrated.
In summary, this indicator acts as a "liquidity visualizer," providing traders with a clear, visual representation of potential liquidity resting at significant pivot points. This information can be valuable for understanding where price might be drawn to, and where large movements might occur as liquidity is targeted and removed by market participants.

Safe Scalpy Stop Loss. Percentage from price visualizer.This is my first script I have published so bear with me.
I have thrown this together so you can easily see on the chart where -0.5%, -1% and -2% would be from the last candle close. I also replicated these to show positive values in case you are shorting.
I have also added a custom value setting so you can set the line at whatever percentage value you like and included an adjustable recent higher high and higher low finder to help create a recent range as it seems to work well in tandem for scalping range based price movement.
You can turn all these things on and off in the settings on the style checkboxes.
I felt the need to make this because I like to scalp trade with leverage like a total degen from time to time. Often the setups happen very quickly. It is difficult to calculate where to set a stop loss in a hurry so I keep a fixed account size/lev and just vary the position percentage size based on the percentage of the stop loss from the current price.
Sometimes when switching from a lower volatility chart to high volatility one it is easy to get caught out by quickly entering a scalp trade only to find you made your position way too big or you shouldn't have entered at all. You thought it was only moving 0.2% per candle instead of 3%. Whoops. Rekt.
This indicator is all about trying to help me avoid that with a visual clue to back up the bad maths I do quickly in my head.
I often hide it and only show it when I'm ready to enter a position to double check my SL and entry are set in a sensible area.
I thought I would publish it in case someone else finds such a simple tool handy.
Apologies if there is already something out there that does this job. I couldn't find it.
See you all on the moon.

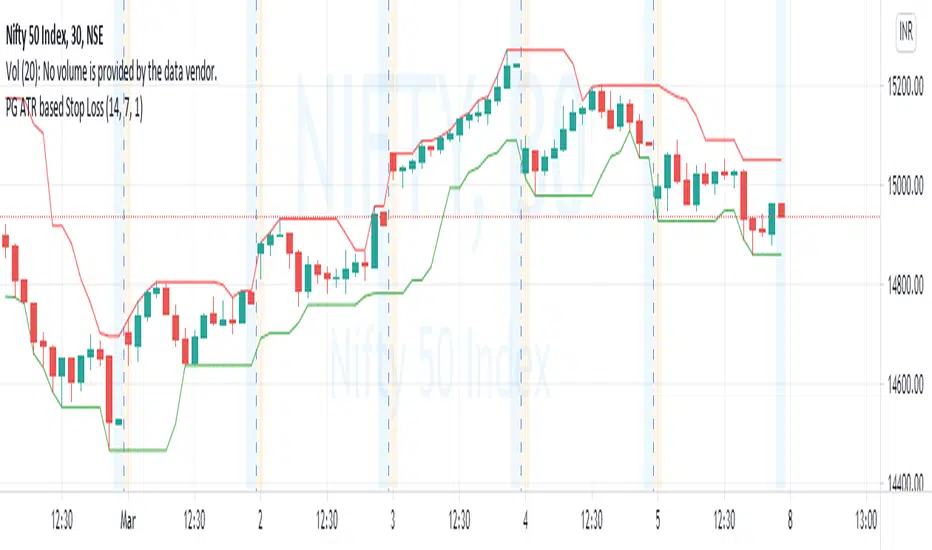
PG ATR based Stop LossA stoploss system that enables traders to exit with limited loss or even trailing loss.
Use the levels of indicator against the candle that has seen signidicant move for running positions and the candle in which a new position is taken.
Example : For long Nifty Future at 14990 levels, when Indicator is showing 14820 at bottom on a 30 min chart, 14820 can be used as a stop loss,
similarly for short conditions upper values above top of he candle will be followed.
For medium term ongoing positions, use the levels marked against candle that offered a major move, or the candles that has put the underlying in a new price zone or range.
15-30 minutes are suitable period for intraday / short term trades. Two hours or day periods can be used for positional trades.
**Queries are welcme.**
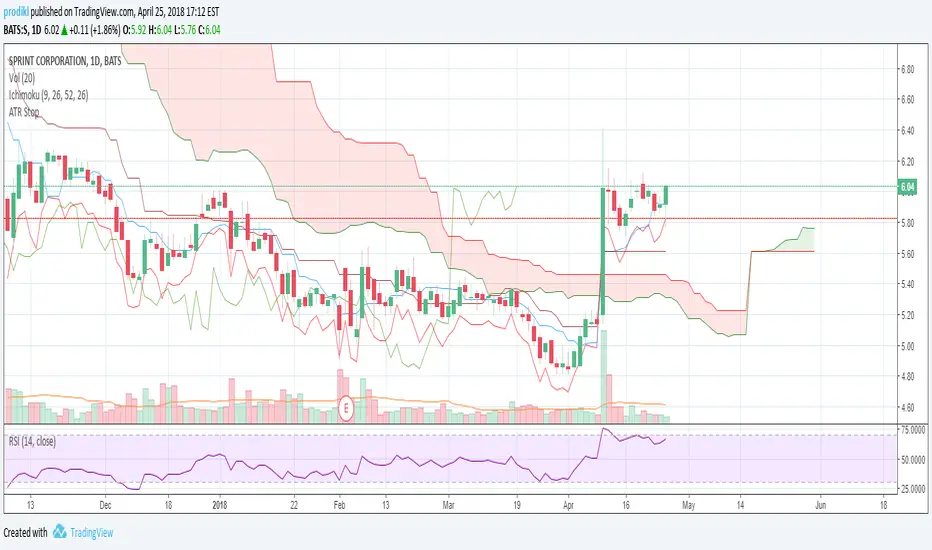
[CP]ATR Triple Stop Loss LevelsATR based Triple Stop Loss levels that are plotted on the chart (like moving averages!).
With ATR Levels plotted on the price chart itself, you can better set your volatility based trailing Stop Loss.
Also helps to define the SL when making an entry into a stock.
Note:
This indicator is supposed to be used on Daily and Weekly Charts.
For other timeframes you would need to tweek the default parameters.

Scripting Tutorial A - TManyMA - StopsThis script is for a triple moving average strategy where the user can select from different types of moving averages, price sources, lookback periods and resolutions.
Features:
- 3 Moving Averages with variable MA types, periods, price sources, resolutions and the ability to disable each individually.
- Crossovers are plotted on the chart with detailed information regarding the crossover (Ex: 50 SMA crossed over 200 SMA )
- Forecasting available for all three MAs. MA values are forecasted 5 values out and plotted as if a continuation to the MA.
- Forecast bias also applies to all forecasting. Bias means we can forecast based on an anticipated bullish, bearish or neutral direction in the market.
- To understand bias, please read the source code, or if you can't read the code just send me a message on here or Twitter. Twitter should be linked to my profile.
- Ribbons added and on by default. Optional setting to disable the ribbons. 5 ribbons between MA1 and MA2 and another 5 between MA2 and MA3.
- Ribbons are alpha-color coded based on their relation to their default MAs.
- Ribbons are only visible between MAs if the MAs being compared share the same Type, Resolution, and Source because there is no way to consolidate those three in a simple manner.
- Ribbon values are calculated based on calculated MA Periods between the MAs.
- Converted the existing study into a strategy.
- Strategy only enters long positions with a market order when MA crossovers occur.
- Strategy exits positions when crossunders occur.
- Trades 100% of the equity with one order/position by default.
- Ability to disable trading certain crosses with input checks.
- Ability to exit trades with a take profit or stop loss.
- User input to allow quick changes to the take profit or stop loss percentages.
This script is meant as an educational script with well-formatted styling, and references for specific functions.
*** PLEASE NOTE - THIS STRATEGY IS MEANT FOR LEARNING PURPOSES. DEPENDING ON IT'S CONFIGURATION IT MAY OR MAY NOT BE USEFUL FOR ACTUAL TRADING. THE STRATEGY IS NOT FINANCIAL ADVICE ***

Binque's Stop LossFixed Script only showing Daily Stop Loss. Now will show stop loss based on the resolution of the chart you are on, i.e. 1 min, 5 min, 15 min, 1 h, 4 h, 1 d, 1 w, 1 month, etc...

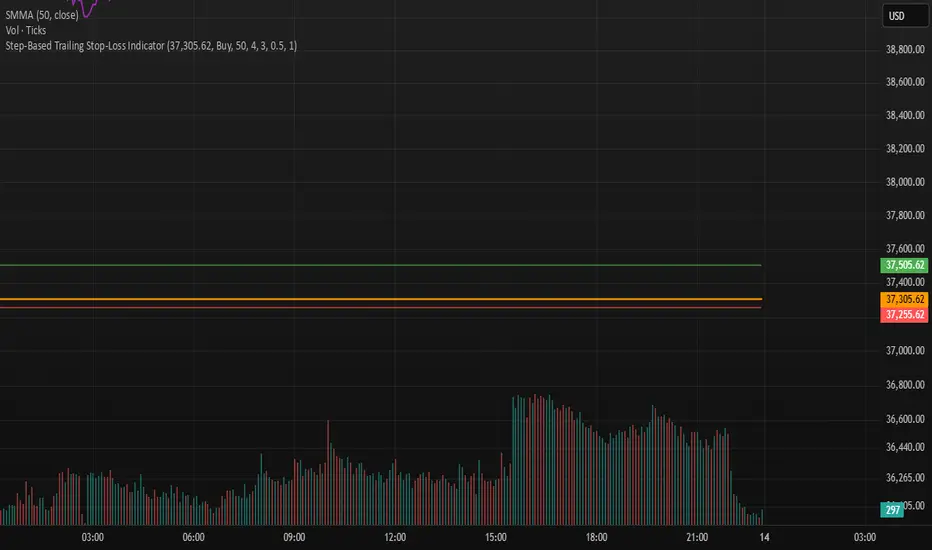
Step-Based Trailing Stop-Loss IndicatorThis indicator is built for momentum traders who want to maximize winning trades and minimize losses through a smart, step-based trailing stop-loss system. Instead of using a fixed Take Profit, this tool dynamically protects profits once the trade reaches a favorable RR (Risk-to-Reward) level.
How It Works:
Manual Entry Input
You enter your Entry Price and select Buy/Sell in the settings.
This flexibility allows backtesting or live trade tracking.
Initial Setup
Default SL: 50 ticks(Tested on us30,but works on any pair you just need to adjust SL)
TP for reference: 4R — can be used for benchmarking, but we don't limit profits with a hard TP.
Trailing Logic
Once price reaches 3R in profit:
The SL begins trailing.
It starts at 2R, keeping a 1R cushion behind the max profit.
For every 0.5R gain, SL also moves up by 0.5R:
Example: At 3.5R → SL is at 2.5R
At 5.0R → SL is at 4.0R
This trailing continues until the SL is hit or the trend exhausts.
Chart Features
🟧 Entry Line
🔴 Initial SL
🟢 Reference TP (4R, optional)
🟣 Dynamic Trailing SL
🏷️ Labels for Entry & SL levels

ATR Stop LossAdds an indicator that can be used to set stop losses.
This is the close price minus the ATR + 10%.
The 10% is there to let the market perform and avoid whipsaws.
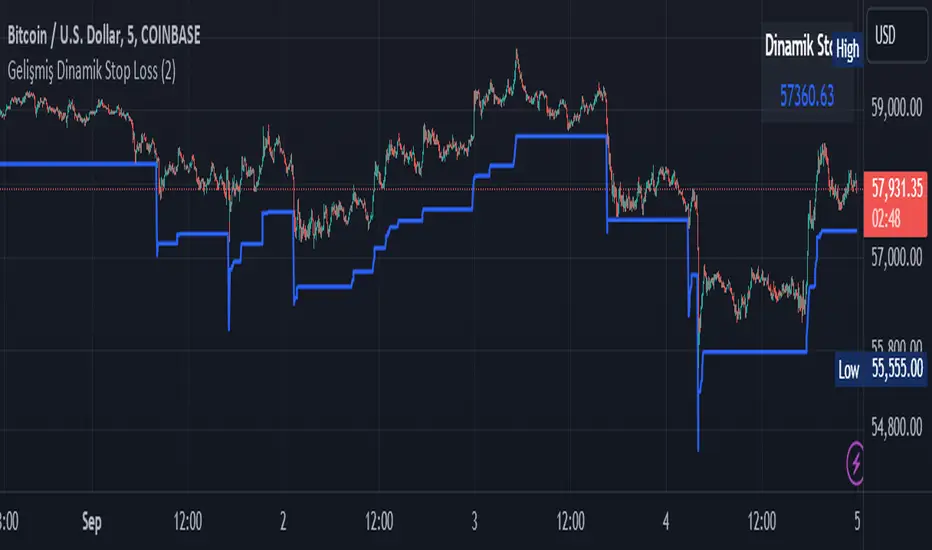
Smart Dynamic Stop Loss (SDSL) IndicatorSmart Dynamic Stop Loss (SDSL) Indicator
The Smart Dynamic Stop Loss (SDSL) Indicator creates a stop loss level that dynamically adapts to market conditions.
How It Works / How To Calculate:
1. **Initialization**: The indicator initially sets a stop loss level at a specified percentage (default 2%, user-adjustable) below the current price.
2. **Upward Movement**: As the price rises, the stop loss level moves up as well. However, it always remains at the specified percentage below the highest price reached. This allows the price room to move while protecting gains.
3. **Downward or Sideways Movement**: When the price falls or moves sideways, the stop loss level remains static. This prevents premature exits during minor pullbacks or consolidations.
4. **Price Crosses Below Stop Loss**: If the price drops below the stop loss level, the indicator resets. It sets a new stop loss level at the specified percentage below the low of the candle where the crossover occurred.
5. **Continuous Adaptation**: This process repeats across the entire chart, constantly adjusting to price movements.
note: When the price intersects with the dynamic stop loss line, it resets at 2% below the candle's lowest value (this is the default value, but it can be adjusted by the user)
Key Features
- **User-Configurable**: The stop loss percentage can be adjusted by the user.
- **Visual Alerts**: The indicator plots the stop loss line on the chart.
- **Triggered Signals**: Optional visual signals are displayed when the stop loss is triggered.
- **Information Display**: A data box shows the current stop loss level.
Usage
1. Apply the indicator to the chart.
2. Adjust the stop loss percentage if desired (default is 2%).
3. Monitor the dynamic stop loss level.
4. Watch for visual alerts for potential signals.
Fibonacci-Only StrategyFibonacci-Only Strategy
This script is a custom trading strategy designed for traders who leverage Fibonacci retracement levels to identify potential trade entries and exits. The strategy is versatile, allowing users to trade across multiple timeframes, with built-in options for dynamic stop loss, trailing stops, and take profit levels.
Key Features:
Custom Fibonacci Levels:
This strategy calculates three specific Fibonacci retracement levels: 19%, 82.56%, and the reverse 19% level. These levels are used to identify potential areas of support and resistance where price reversals or breaks might occur.
The Fibonacci levels are calculated based on the highest and lowest prices within a 100-bar period, making them dynamic and responsive to recent market conditions.
Dynamic Entry Conditions:
Touch Entry: The script enters long or short positions when the price touches specific Fibonacci levels and confirms the move with a bullish (for long) or bearish (for short) candle.
Break Entry (Optional): If the "Use Break Strategy" option is enabled, the script can also enter positions when the price breaks through Fibonacci levels, providing more aggressive entry opportunities.
Stop Loss Management:
The script offers flexible stop loss settings. Users can choose between a fixed percentage stop loss or an ATR-based stop loss, which adjusts based on market volatility.
The ATR (Average True Range) stop loss is multiplied by a user-defined factor, allowing for tailored risk management based on market conditions.
Trailing Stop Mechanism:
The script includes an optional trailing stop feature, which adjusts the stop loss level as the market moves in favor of the trade. This helps lock in profits while allowing the trade to run if the trend continues.
The trailing stop is calculated as a percentage of the difference between the entry price and the current market price.
Multiple Take Profit Levels:
The strategy calculates seven take profit levels, each at incremental percentages above (for long trades) or below (for short trades) the entry price. This allows for gradual profit-taking as the market moves in the trade's favor.
Each take profit level can be customized in terms of the percentage of the position to be closed, providing precise control over exit strategies.
Strategy Backtesting and Results:
Realistic Backtesting:
The script has been backtested with realistic account sizes, commission rates, and slippage settings to ensure that the results are applicable to actual trading scenarios.
The backtesting covers various timeframes and markets to ensure the strategy's robustness across different trading environments.
Default Settings:
The script is published with default settings that have been optimized for general use. These settings include a 15-minute timeframe, a 1.0% stop loss, a 2.0 ATR multiplier for stop loss, and a 1.5% trailing stop.
Users can adjust these settings to better fit their specific trading style or the market they are trading.
How It Works:
Long Entry Conditions:
The strategy enters a long position when the price touches the 19% Fibonacci level (from high to low) or the reverse 19% level (from low to high) and confirms the move with a bullish candle.
If the "Use Break Strategy" option is enabled, the script will also enter a long position when the price breaks below the 19% Fibonacci level and then moves back up, confirming the break with a bullish candle.
Short Entry Conditions:
The strategy enters a short position when the price touches the 82.56% Fibonacci level and confirms the move with a bearish candle.
If the "Use Break Strategy" option is enabled, the script will also enter a short position when the price breaks above the 82.56% Fibonacci level and then moves back down, confirming the break with a bearish candle.
Stop Loss and Take Profit Logic:
The stop loss for each trade is calculated based on the selected method (fixed percentage or ATR-based). The strategy then manages the trade by either trailing the stop or taking profit at predefined levels.
The take profit levels are set at increments of 0.5% above or below the entry price, depending on whether the position is long or short. The script gradually exits the trade as these levels are hit, securing profits while minimizing risk.
Usage:
For Fibonacci Traders:
This script is ideal for traders who rely on Fibonacci retracement levels to find potential trade entries and exits. The script automates the process, allowing traders to focus on market analysis and decision-making.
For Trend and Swing Traders:
The strategy's flexibility in handling both touch and break entries makes it suitable for trend-following and swing trading strategies. The multiple take profit levels allow traders to capture profits in trending markets while managing risk.
Important Notes:
Originality: This script uniquely combines Fibonacci retracement levels with dynamic stop loss management and multiple take profit levels. It is not just a combination of existing indicators but a thoughtful integration designed to enhance trading performance.
Disclaimer: Trading involves risk, and it is crucial to test this script in a demo account or through backtesting before applying it to live trading. Users should ensure that the settings align with their individual risk tolerance and trading strategy.

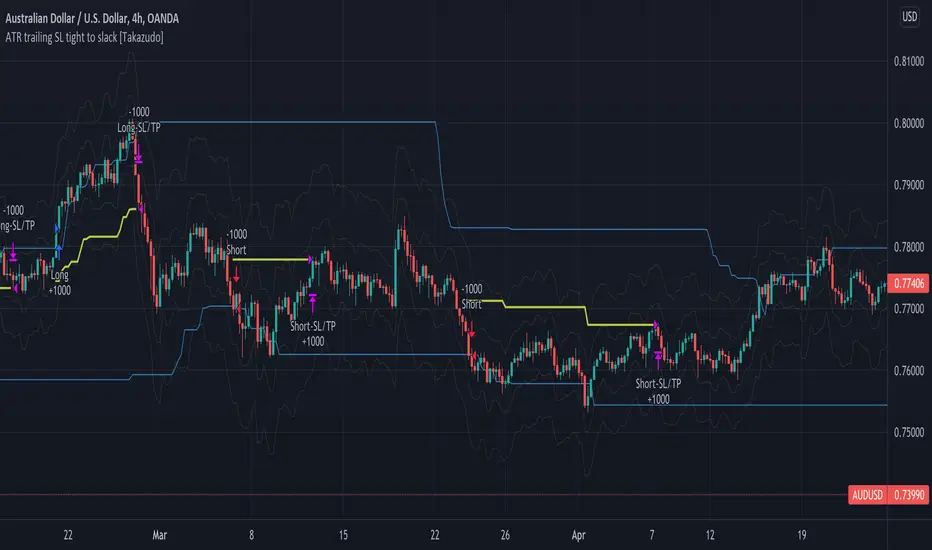
ATR trailing Stop Loss tight to slack [Takazudo]This is a demo of ATR based trailing Stop Loss.
This SL strategy uses 2 types of ATR based SL.
tight SL as initial (ATR * 1.5)
slack SL as trailing (ATR * 4)
When any entry singal occurs by the buy/sell conditions, this SL strategy uses the "tight SL" as the initial SL.
Then the SL will chase the price as trailing SL. However, this strategy uses the "slack SL" in this trailing phase.
So you can set the tight SL first.
Then SL will chase the price as the slack one.
Note: The entry strategy in this script is not intented to win. Check the result. Be careful. Just a module of my strategy.
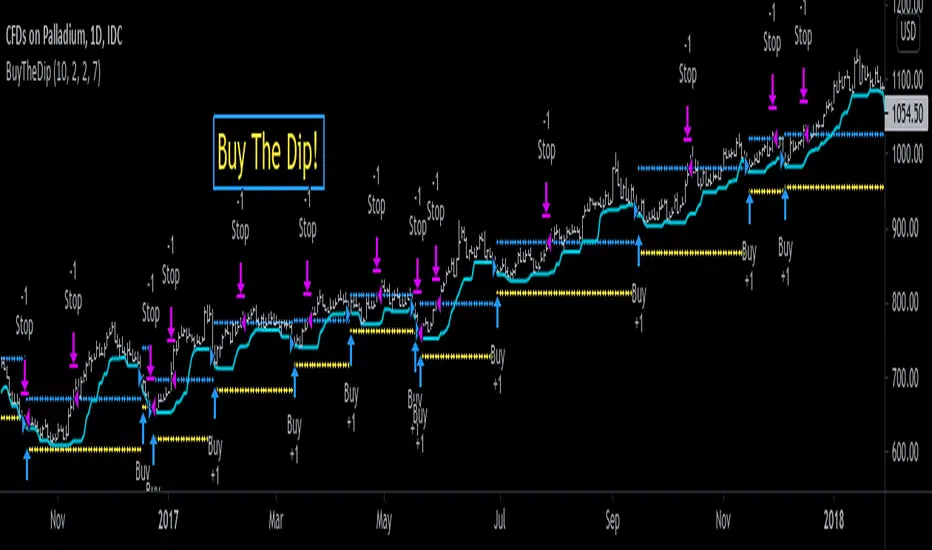
Buying Dip Strategy With Take Profit And Stop Loss [racer8]"Buy low, sell high."
This system buys the dip and takes profit for a high win rate.
It uses an ATR take profit and ATR stop loss.
It buys the dip when the close is below the previous 7 day low.
Daily timeframe is best.
Enjoy ♡
Buy - Take Profit OR Stop Loss % BasedScript looks back for a certain period of time and than enter when price close above that look back period ema. Once enter it does not care for how many times price cross above or below. Once entered, it will either hit percenatage based take profit of stop loss.

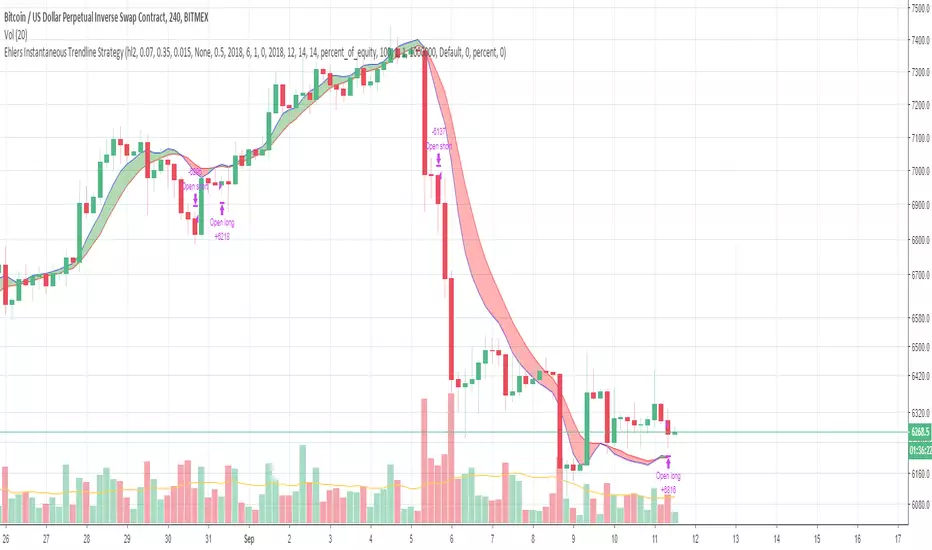
Ehlers Instantaneous Trendline StrategyInstantaneous Trendline Strategy by John Ehlers from his book "Cybernetic Analysis for Stocks and Futures".
You can choose implementation of stop-loss. Don't forget to define correct spread for your instrument.
Shares to Stop Loss📊 Shares to Stop Loss Calculator
This indicator automatically calculates the optimal number of shares to trade based on your predefined risk amount and dynamic stop loss levels.
🎯 Key Features:
Automatic Position Sizing: Calculates exact number of shares for both LONG and SHORT positions based on your risk tolerance
Dynamic Stop Loss Levels: Uses relative highs and lows from a customizable lookback period
Visual Reference Lines: Displays horizontal lines showing your stop loss levels on the chart
Real-time Updates: Position size adjusts automatically with price movement
Clean Interface: Compact table showing all relevant information without cluttering your chart
⚙️ How It Works:
For SHORT positions:
Stop loss is placed at the relative high (highest price in the lookback period)
Calculates shares needed to risk your specified dollar amount
For LONG positions:
Stop loss is placed at the relative low (lowest price in the lookback period)
Calculates shares needed to risk your specified dollar amount
📝 Inputs:
Amount for stop loss ($): Your maximum risk per trade in dollars (default: $100)
Look back candles for rel. HIGH: Period to calculate the relative high for SHORT stops (default: 20)
Look back candles for rel. LOW: Period to calculate the relative low for LONG stops (default: 20)
Line colors: Customize the appearance of reference lines
💡 Use Case:
Perfect for traders who practice proper risk management and want to maintain consistent dollar risk across different price levels and volatility conditions. Simply set your risk amount once, and the indicator does the math for you on every candle.
⚠️ Note: This indicator calculates position sizes based on technical levels. Always consider liquidity, account size, and broker requirements before entering positions.

Live Position Sizer (LPS)Description (EN)
(Magyar leíráshoz görgess lejjebb!)
Live Position Sizer (LPS) is a discretionary trading utility designed to visualize risk, reward, and position size directly on the chart in real time.
The indicator draws a TradingView-style long or short position box and calculates the required position size based on your defined capital, maximum risk, stop-loss distance, and a user-defined lot conversion factor.
LPS is intended strictly as a decision-support and risk management tool. It does not place trades or generate automated signals.
Core features:
Automatic Long / Short position visualization
Dynamic Entry, Stop Loss, and Take Profit levels
Real-time position size calculation
Configurable Risk/Reward ratio
Fully customizable colors, transparency, and line styles
Clean, minimal on-chart labels showing direction, RR, and lot size
Only one active position box at a time for a clutter-free chart
Position sizing logic:
TradingView internally calculates position size in units, not broker-specific lots.
To bridge this difference, LPS uses a user-defined “Units per 1 Lot” multiplier.
Examples:
Forex (standard lot): 100000
Gold (XAUUSD): 1 or 100 (broker dependent)
Indices (e.g. NAS100): 1
The indicator first calculates the position size in TradingView units and then converts it to lots using this multiplier.
The displayed lot size is rounded to 0.01 lots.
Stop Loss logic:
The Stop Loss level is derived from the High or Low of a selectable previous candle.
Increasing the bar-back value places the Stop Loss further away, which:
increases stop distance
reduces position size for the same risk
Intended use:
Manual / discretionary trading
Risk management and position sizing
Trade planning and visualization
Educational purposes
Important notes:
This indicator does not execute trades
No alerts or automation by default
Lot size and contract specifications vary by broker
Always verify the exact lot or contract size with your broker before trading
------------------------------------
Description (HU)
A Live Position Sizer (LPS) egy diszkrecionális kereskedést támogató segédindikátor, amely valós időben jeleníti meg a kockázatot, a célárat és a pozícióméretet közvetlenül a charton.
Az indikátor TradingView-stílusú long vagy short pozíció boxot rajzol, és kiszámolja a szükséges pozícióméretet a megadott tőke, maximális kockázat, stop-loss távolság és egy felhasználó által definiált LOT szorzó alapján.
Az LPS nem stratégia, kizárólag döntéstámogató és kockázatkezelési eszköz.
Fő funkciók:
Automatikus Long / Short pozíció megjelenítés
Entry, Stop Loss és Take Profit szintek vizuális ábrázolása
Valós idejű pozícióméret számítás
Állítható Risk/Reward arány
Teljesen testreszabható színek, átlátszóság és vonalstílus
Letisztult chart label (irány, RR, lot méret)
Egyszerre csak egy aktív pozíció box
Pozícióméretezési logika:
A TradingView belsőleg egységekben (units) számol, nem bróker-specifikus LOT-okban.
Ennek kezelésére az LPS egy „Units per 1 Lot” beállítást használ.
Példák:
Forex standard lot: 100000
Arany (XAUUSD): 1 vagy 100 (brókertől függ)
Indexek (pl. NAS100): 1
Az indikátor először TradingView egységekben számol, majd ezt átváltja LOT-ra a megadott szorzó segítségével.
A kijelzett LOT méret 0.01-re van kerekítve.
Stop Loss logika:
A Stop Loss szint a kiválasztott korábbi gyertya high vagy low értékéből kerül meghatározásra.
Nagyobb bar-back érték:
távolabb helyezi a stopot
azonos kockázat mellett kisebb pozícióméretet eredményez
Ajánlott felhasználás:
Manuális, diszkrecionális kereskedés
Kockázatkezelés és pozícióméretezés
Trade tervezés
Oktatási célok
Fontos megjegyzések:
Az indikátor nem köt automatikusan
Alapértelmezetten nincs alert vagy automatizmus
A LOT és contract méret brókerenként eltérhet
Kereskedés előtt mindig ellenőrizd a pontos LOT / contract specifikációt a brókerednél

Apex Edge Sentinel - Stop Loss HUDApex Edge – ATR Sentinel Stop Loss HUD
The Apex Edge – ATR Sentinel is a complete stop-loss intelligence system built as a clean, always-on HUD.
It delivers institutional-level risk guidance by calculating and displaying live ATR-based stop levels for both long and short trades at multiple risk tolerances.
Forget cluttered charts and repainting lines — Sentinel gives you a clear stop-loss reference panel that updates dynamically with every bar.
✅ Features
• Triple ATR Multipliers
User-defined (e.g. x1.5 / x2.0 / x2.5). Compare tight, medium, and wide stops instantly.
• Dual-Side SL Levels
Both Long and Short safe stop prices displayed side by side. No more guessing trend
bias.
• ATR Transparency
HUD shows ATR(length) so you always know the calculation basis. Default = 14, adjustable
to your style.
• ATR Regime Meter
Detects volatility conditions (LOW / NORMAL / HIGH) by comparing ATR to its SMA. Helps
you avoid over-tight stops in high-volatility markets.
• Tick-Aware Rounding
Stop levels auto-rounded to the instrument’s tick size (Gold = 0.10, FX = 0.0001, indices =
whole points).
Custom HUD Design
• Location: Top/Bottom, Left/Right
• Sizes: Compact / Medium / Large (desktop or mobile)
• Opacity control (25% default Apex styling)
How to Use
1. Load Sentinel on your chart.
2. Check the HUD:
• ATR(14): 2.6 → base volatility measure.
• x1.5 / x2.0 / x2.5 → instant SL levels for both long & short trades.
3. Before entering a trade → decide which multiplier matches your style (tight scalper vs wider swing).
4. Manually place your SL at the level displayed in the HUD.
Sentinel works as both:
• A pre-trade check (is ATR stop too wide for my RR?).
• A live risk compass (updated stop levels every bar).
Why Apex Sentinel?
Most ATR stop indicators clutter charts with lagging lines or repainting trails. Sentinel strips it back to what matters:
• The numbers.
• The risk levels.
• The context.
It’s a pure stop-loss HUD, designed for serious traders who want clarity, discipline, and instant reference points across any market or timeframe.
Notes
• This is a HUD-only system (no automatic SL line). Traders manually apply the SL level
shown in the panel.
• Defaults: ATR(14), multipliers 1.5 / 2.0 / 2.5. Adjust to your trading style.
• Best used on intraday pairs like XAUUSD, EURUSD, indices, but works universally.
Apex Edge Philosophy: Clean. Smart. Institutional.
No clutter. No gimmicks. Just precision tools for modern markets.

Dynamic Stop Loss Optimizer [BackQuant]Dynamic Stop Loss Optimizer
Overview
Stop placement decides expectancy. This tool gives you three professional-grade, adaptive stop engines, ATR, Volatility, and Hybrid. So your exits scale with current conditions instead of guessing fixed ticks. It trails intelligently, redraws as the market evolves, and annotates the chart with clean labels/lines and a compact stats table. Pick the engine that fits the trade, or switch on the fly.
What it does
Calculates three adaptive stops in real time (ATR-based, Volatility-based, and Hybrid) and keeps them trailed as price makes progress.
Shows exactly where your risk lives with on-chart levels, color-coded markers (long/short), and precise “Risk %” labels at the current bar.
Surfaces context you actually use - current ATR, daily volatility, selected method, and the live stop level—in a tidy, movable table.
Fires alerts on stop hits so you can automate exits or journal outcomes without staring at the screen.
Why it matters
Adaptive risk control: Stops expand in fast tape and tighten in quiet tape. You’re not punished for volatility; you’re aligned with it.
Consistency across assets: The same playbook works whether you’re trading indexes, FX, crypto, or equities, because the engine normalizes to each symbol’s behavior.
Cleaner decision-making: One chart shows your entry idea and its invalidation in the same breath. If price trespasses, you know it instantly.
The three methods (choose your engine)
1) ATR Based “Structure-aware” distance
This classic approach keys off Average True Range to set a stop just beyond typical bar-to-bar excursion. It adapts smoothly to changing ranges and respects swing structure.
Use when: you want a steady, intuitive buffer that tracks trend legs without hugging price.
See it in action:
2) Volatility Based “Behavior-aware” distance
This engine derives stop distance from current return volatility (annualized, then scaled back down to the session). It reacts to regime shifts quickly and normalizes risk across symbols with very different prices.
Use when: you want the stop to breathe with realized volatility and respond faster to heat-ups/cool-downs.
See it in action:
3) Hybrid “Best of both worlds”
The Hybrid blends the ATR and Volatility distances into one consensus level, then trails it intelligently. You get the structural common sense of ATR and the regime sensitivity of Vol.
Use when: you want robust, all-weather behavior without micromanaging inputs.
See it in action:
How it trails
Longs: The stop ratchets up with favorable movement and holds its ground on shallow pullbacks. If price closes back into the risk zone, the level refreshes to the newest valid distance.
Shorts: Mirror logic ratchets down with trend, resists noise, and refreshes if price reclaims the zone.
Hybrid trailing: Uses the blended distance and the same “no give-backs” principle to keep gains protected as structure builds.
Reading the chart
Markers: Circles = ATR stops, Crosses = Vol stops, Diamonds = Hybrid. Colors indicate long (red level under price) vs short (green level above price).
Lines: The latest active stop is extended with a dashed line so you can see it at a glance.
Labels: “Long SL / Short SL” shows the exact price and current risk % from the last close no math required.
Table: ATR value, Daily Vol %, your chosen Method, the Current SL, and Risk %—all in one compact block that you can pin top-left/right/center.
Quick workflow
Define the idea: Long or Short, and which engine fits the tape (ATR, Vol, or Hybrid).
Place and trail: Let the optimizer print the level; trail automatically as the move develops.
Manage outcomes: If the line is tagged, you’re out clean. If it holds, you’ve contained heat while giving the trade room to work.
Inputs you’ll actually touch
Calculation Settings
ATR Length / Multiplier: Controls the “structural” cushion.
Volatility Length / Multiplier: Controls the “behavioral” cushion.
Trading Days: 252 or 365 to keep the volatility math aligned with the asset’s trading calendar.
Stop Loss Method
ATR Based | Volatility Based | Hybrid : Switch engines instantly to fit the trade.
Position Type
Long | Short | Both : Show only what you need for the current strategy.
Visual Settings
Show ATR / Vol / Hybrid Stops: Toggle families on/off.
Show Labels: Print price + Risk % at the live stop.
Table Position: Park the metrics where you like.
Coloring
Long/Short/Hybrid colors: Set a palette that matches your theme and stands out on your background.
Practical patterns to watch
Trend-pullback continuation: The stop ratchets behind higher lows (long) or lower highs (short). If price tests the level and rejects, that’s your risk-defined continuation cue.
Break-and-run: After a clean break, the Hybrid will usually sit slightly wider than pure Vol, use it to avoid getting shaken on the first retest.
Range compression: When the ATR and Vol distances converge, the table will show small Risk %. That’s your green light to size up with the same dollar risk, or keep it conservative if you expect expansion.
Alerts
Long Stop Loss Hit : Notifies when price crosses below the live long stop.
Short Stop Loss Hit : Notifies when price crosses above the live short stop.
Why this feels “set-and-serious”
You get a single look that answers three questions in real time: “Where’s my line in the sand?”, “How much heat am I taking right now?”, and “Is this distance appropriate for current conditions?” With ATR, Vol, and Hybrid in one tool, you can run the exact same playbook across symbols and regimes while keeping your chart clean and your risk explicit.

NQ Position Size CalculatorNQ Position Size Line Calculator is designed specifically for Nasdaq 100 futures (NQ) and micro futures (MNQ) traders who want to maintain disciplined risk management. This visual tool eliminates the guesswork from position sizing by displaying distance lines and contract calculations directly on your chart.
The indicator creates horizontal lines at 10-tick intervals from your stop loss level, showing you exactly how many contracts to trade at each distance to maintain your predetermined risk amount. Whether you're trading regular NQ contracts or micro MNQ contracts, this calculator ensures you never risk more than intended while providing instant visual feedback for optimal position sizing decisions.
How to Use the Indicator
Step 1: Configure Your Settings
Stop Loss Price: Enter your exact stop loss level (e.g., 20000.00)
Risk Amount ($): Set your maximum dollar risk per trade (e.g., $500)
Contract Type: Choose between:
NQ (Regular): $5 per tick - for larger accounts
MNQ (Micro): $0.50 per tick - for smaller accounts or conservative sizing
Display Options:
Max Lines: Number of distance lines to show (default: 30)
Show Labels: Toggle tick distance and contract count labels
Line Color: Customize the color of distance lines
Label Size: Choose tiny, small, or normal label sizes
Step 2: Read the Visual Display
Once configured, the indicator displays:
Stop Loss Line:
Thick yellow line marking your exact stop loss level
Yellow label showing the stop loss price
Distance Lines:
Dashed red lines at 10-tick intervals above and below your stop loss
Lines appear on both sides for long and short position planning
Labels (if enabled):
Green labels (right side): For long positions above your stop loss
Red labels (left side): For short positions below your stop loss
Format: "20T 5x" means 20 ticks distance, 5 contracts maximum
Step 3: Use the Information Tables
The indicator provides two helpful tables:
Position Size Table (top-right):
Shows common tick distances (10, 20, 40, 80, 160 ticks)
Displays risk per contract at each distance
Contract count for your specified risk amount
Total risk with rounded contract numbers
Settings Table (bottom-right):
Confirms your current risk amount
Shows selected contract type
Displays current settings for quick reference
Step 4: Apply to Your Trading
For Long Positions:
Look at the green labels on the right side of your chart
Find your desired entry level
Read the label to see: distance in ticks and maximum contracts
Example: "30T 8x" = 30 ticks from stop, buy 8 contracts maximum
For Short Positions:
Look at the red labels on the left side of your chart
Find your desired entry level
Read the label for tick distance and contract count
Example: "40T 6x" = 40 ticks from stop, sell 6 contracts maximum
Step 5: Trading Execution
Before Entering a Trade:
Identify your stop loss level and input it into the indicator
Choose your entry point by looking at the distance lines
Note the contract count from the corresponding label
Verify the risk amount matches your trading plan
Execute your trade with the calculated position size
Risk Management Features:
Contract rounding: All position sizes are rounded down (never up) to ensure you don't exceed your risk limit
Zero position filtering: Lines only show where position size is at least 1 contract
Dual-sided display: Plan both long and short opportunities simultaneously
